 Catalogue Shom
http://www.shom.fr/HOM/ROEC_TURBI
Type of resources
Available actions
Topics
Provided by
Formats
Representation types
-
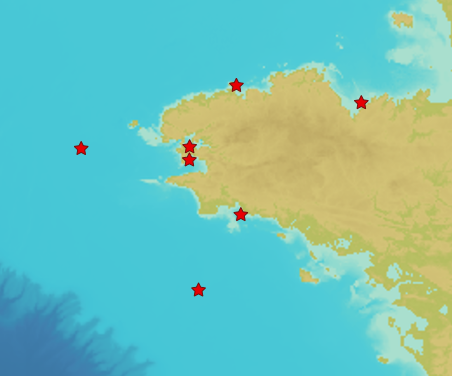
In early 2017, Shom established a near-bottom turbidity observation network to measure turbidity and currents near the seabed continuously, at high frequency and over a long period of time (several years). Seven mooring points with ecological and / or sedimentological interests and impacted by anthropogenic activities (except the control point in the Celtic Sea) have thus been defined. The product "Turbidity Time Series ROEC" contains turbidity level records measured in NTU by optical turbidimeters implanted at each of the 7 wetting points of the monitoring network. The data present in the product "ROEC Turbidity Time Series" corresponds to raw data from NTUS sensors (Wetlabs) deployed on different moorings and transcoded in .CSV format. The time series are provided in their entirety and have not been post-processed. The files can therefore include certain erroneous values related to specific anomalies in the acquisition made by the sensor or intervals without data when the acquisition knows ranges of interruption.
-
In early 2017, Shom established a near-bottom turbidity observation network to measure turbidity and currents near the seabed continuously, at high frequency and over a long period of time (several years). Seven mooring points with ecological and / or sedimentological interests and impacted by anthropogenic activities (except the control point in the Celtic Sea) have thus been defined. The product "Turbidity Time Series ROEC" contains turbidity level records measured in NTU by optical turbidimeters implanted at each of the 7 wetting points of the monitoring network as well as currents recordings (speed (m/s) and direction (°) measured by a single-point current meter. The data present in the product "ROEC Turbidity Time Series" corresponds to raw data from NTUS sensors (Wetlabs) and Aquadopp (Nortek) deployed on different moorings and transcoded in .CSV format. The time series are provided in their entirety and have not been post-processed. The files can therefore include certain erroneous values related to specific anomalies in the acquisition made by the sensor or intervals without data when the acquisition knows ranges of interruption.